Plotting graphs of functions defined explicitly in the Cartesian coordinate system.
For a differentiable function $f(x)$ on the interval $(a,b)$ to strictly increase on this interval, it is sufficient that the derivative $f'(x)$ be strictly positive everywhere on $(a,b)$, i.e., $f'(x) > 0,,, x \in (a,b).$
For a differentiable function $f(x)$ on the interval (a,b) to be increasing (not decreasing) on this interval, it is sufficient that the derivative $f'(x)$ be non-negative everywhere on $(a,b)$, i.e., $f'(x) \geq 0,,, x \in (a,b).$
Similarly, the condition for the strict decrease of a differentiable function $f(x),,,x \in (a,b)$ is $f'(x) < 0,,, x \in (a,b).$
The condition for the decrease (non-increase) of a differentiable function $f(x),,,x \in (a,b)$ is $f'(x) \leq 0,,,x \in (a,b).$
Let the function be differentiable in some neighborhood of the point $x_0$, except possibly at the point $x_0$ itself, where the function $f(x)$ is continuous. Then the point $x_0$ is a point of strict maximum if there exists a neighborhood of the point $x_0$ where $f'(x) > 0$ for $x < x_0$ and $f'(x) < 0$ for $x > x_0.$
If $f'(x) < 0$ for $x < x_0$ and $f'(x) > 0$ for $x > x_0,$ then $x_0$ is a point of strict minimum.
Definition: The points of maximum and minimum are called points of extremum, and the value of the function at these points are called extremums.
Let the function $f(x)$ be continuous on the segment $[a,b]$ and have $k$ local maxima at points $x_1,, x_2,...x_k.$ Then the greatest value of the function $f(x)$ on the segment $[a,b]$ is equal to the largest of the numbers:$$f(a,)\,f(x_1),...,f(x_k), f(b).$$
Similarly, if the function $f(x)$ is continuous on the segment $[a,b]$ and has $n$ local minima at points $x_1',,, x_2',.., x'_n,$ then its smallest value on this segment is equal to the smallest of the numbers:$$f(a),\, f(x_1'), f(x_2'),..., f(x_n'), f(b).$$
For the function $f(x),$ which is twice differentiable on the interval $(a,b),$ to be concave downwards on this interval, it is necessary and sufficient for the second derivative $f''(x)$ to be non-negative on $(a,b),$ that is, $f''(x) \geq 0,,, x \in (a,b).$
The condition $f''(x) > 0,,, x \in (a,b)$ is the condition for strict concavity downwards.
If $f''(x) \leq 0,,, x \in (a,b) -$ the function is convex upwards. $f''(x) < 0$ is the condition for strict convexity.
If the function $f(x)$ changes the direction of its convexity when crossing the point $x_0$, then the point $x_0$ is called an inflection point.
The function $f(x)$ is called even if $f(x) = f(-x);$
The function $f(x)$ is called odd if $f(x) = -f(-x).$
Finding asymptotes:
If $\lim\limits_{x \to X_0-0} f(x) = \infty$ or $\lim\limits_{x \to x_0+0} f(x) = \infty,$ then the line $x = x_0$ is called a vertical asymptote of the graph.
For the line $y = kx + b$ to be an asymptote of the graph of the function $y = f(x)$ as $x \to +\infty,,$ ($x \to -\infty$), it is necessary and sufficient that $$\lim\limits_{x\rightarrow+\infty}\frac{f(x)}{x}=k \quad \left(\lim\limits_{x\rightarrow-\infty}\frac{f(x)}{x}=k\right)$$
$$\lim\limits_{x\rightarrow+\infty}(f(x)-kx)=b\quad (\lim\limits_{x\rightarrow-\infty}(f(x)-kx)=b).\qquad\qquad(1)$$
In the case of a horizontal asymptote $(k=0)$, instead of (1), we have: for the line $y=b$ to be a horizontal asymptote of the graph of the function $y=f(x)$ as $x\rightarrow+\infty$ (or as $x\rightarrow-\infty$), it is necessary and sufficient that
$$\lim\limits_{x\rightarrow+\infty}f(x)=b\quad (\lim\limits_{x\rightarrow-\infty}f(x)=b).$$
Graph Plotting.
When plotting the graph of a function, it is convenient to follow the scheme below.
1. Determine the domain of the function.
2. Check whether the function is even, odd, or periodic.
3. Find the points where the graph intersects the coordinate axes, intervals where the function values are positive, and negative. Identify any points of discontinuity of the function.
4. Find the asymptotes of the graph.
5. Compute the first derivative to determine intervals of increase and decrease of the function. Identify extremum points.
6. Compute the second derivative to find the inflection points of the graph and intervals of concavity and convexity.
7. Sketch the graph of the function.
Example of a complete function analysis and graph plotting.
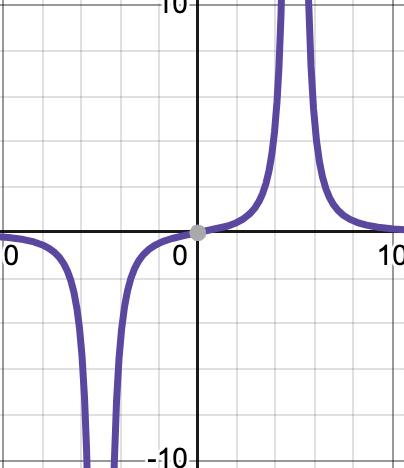
Conduct a full analysis of the function $y = \frac{x^2}{2} + \frac{1}{x}$ and plot its graph.
Solution.
$y = \frac{x^2}{2} + \frac{1}{x} = \frac{x^3 + 2}{2x}$
1. Find the domain of the function, intervals of continuity, and points of discontinuity of the function:
Domain of definition: $D(f) = (-\infty, 0)\cap(0, + \infty)$ This function, being elementary, is continuous at each point within its domain. The point $x = 0$ is a discontinuity point.
$y(-x) = \frac{-x^3 + 2}{-2x } \neq y(x), \neq -y(x)$
The function is neither even nor odd.
The function is not periodic.
There are no intersection points with the Oy axis: $x \neq 0$ .
Intersection point with the Ox axis: $y = 0 \Rightarrow x^3 + 2 = 0 \Rightarrow x = -\sqrt[3]{2}$. That is, the curve passes through the point $(-\sqrt[3]{2}, 0).$
2. Find the asymptotes of the graph.
Vertical asymptotes may occur at points of discontinuity. Find the one-sided limits of the function $y(x)$ at this point.
$\lim\limits_{x \rightarrow -0} f(x) = \lim\limits_{x \rightarrow -0} \left(\frac{x^3 + 2}{2x}\right) = \frac{-0 + 2}{-0} = -\infty$
$\lim\limits_{x \rightarrow +0} f(x) = \lim\limits_{x \rightarrow +0} \left(\frac{x^3 + 2}{2x}\right) = \frac{+0 + 2}{+0} = +\infty$
Thus, both limits are infinite, and the line $x = 0$ serves as a vertical asymptote.
Oblique asymptotes are defined by the equation $y = kx + b$, where
$$k = \lim\limits_{x \rightarrow \infty} \frac{y(x)}{x} = \lim\limits_{x \rightarrow \infty} \frac{\frac{x^3 + 2}{2x}}{x} = \lim\limits_{x \rightarrow \infty} \frac{x^3 + 2}{2x^2} = \infty$$
$b = \lim\limits_{x \rightarrow \infty}(y(x) - kx)$
Thus, the function does not have oblique asymptotes.
3. Let's calculate the derivative of the function and find its intervals of monotonicity and extrema.
$$y' = \left(\frac{x^3 + 2}{2x}\right)' = \frac{(x^3 + 2)' 2x - (x^3 + 2)(2x)'}{(2x^2)} = \frac {3x^2 2x - (x^3 + 2) 2}{4x^2} = $$
$$= \frac{6x^3 - 2x^3 - 4}{4x^2}=\frac{4x^3 - 4}{4x^2} = \frac{x^3 - 1}{x^2}$$
$$y' = 0 \Leftrightarrow \frac{x^3 - 1}{x^2} = 0 \Leftrightarrow x^3 - 1 = 0 \Leftrightarrow x = 1$$
$$y' > 0 \Leftrightarrow \frac{x^3 - 1}{x^2} > 0 \Leftrightarrow x^3 - 1 > 0 \Leftrightarrow x > 1$$
$$y' < 0 \Leftrightarrow \frac{x^3 - 1}{x^2} < 0 \Leftrightarrow x^3 - 1 =<0 \Leftrightarrow x < 1$$
$$y(1) = \frac{1 + 2}{2} = 1.5$$
At the point $x=1$ the derivative changes sign from "-" to "+", therefore the function has a minimum at this point.
4. Let's calculate the second derivative and use it to investigate the graph for intervals of convexity and concavity and inflection points.
$$y' = \left(\frac{x^3 - 1}{x^2}\right)' = \frac{(x^3 -1)' x^2 - (x^2)'(x^3 - 1)}{(x^4)} = \frac {3x^2 x^2 - 2x(x^3 -1) }{x^4} = $$
$$ = \frac {3x^4 - 2x^4 + 2x }{x^4} = \frac{x^4 + 2x}{x^4} = \frac{x^3 + 2}{x^3}$$
$$y'' = 0 \Leftrightarrow \frac{x^3 -+ 2}{x^3} = 0 \Leftrightarrow x^3 = -2 \Leftrightarrow x = -\sqrt[3]{2}$$
$$y'' < 0 \Leftrightarrow \frac{x^3 -+ 2}{x^3} < 0$$
$$y'' > 0 \Leftrightarrow \frac{x^3 -+ 2}{x^3} > 0$$
$x$ $(-\infty;-\sqrt[3]2)$ $-\sqrt[3]2$ $(\sqrt[3]2;0)$ 0 $(0; +\infty)$
$y''$ + 0 - не существует +
$y$ $\cup$ 0 $\cap$ не существует $\cup$
When $x \in(-\sqrt[3]{2}, 0).$, so the function is convex upward, When $x \in(-\infty, -\sqrt[3]{2})\cup (0, +\infty).$ , he function is concave downward.
5. Using the obtained data, let's plot the graph.
Tags: asymptotes, calculus, concave, derivative, domain of the function, extremum, graphs of functions, mathematical analysis